
Data Valuation Methods: How to Put a Number on a Dataset
Imagine a regional logistics company that asks three of its teams what its delivery-route data is worth. Finance comes back with $250,000, operations with $191,000, and partnerships with $300,000. All three figures are defensible, and by the end of this article you will know why they differ and which method fits the decision you face.
Choosing the method matters as much as doing the math. Value data at what it would cost to replace and you learn nothing about what it earns. Value it on hoped-for savings without stating the odds, and nobody can check your figure. We will rebuild all three of those numbers later, line by line.
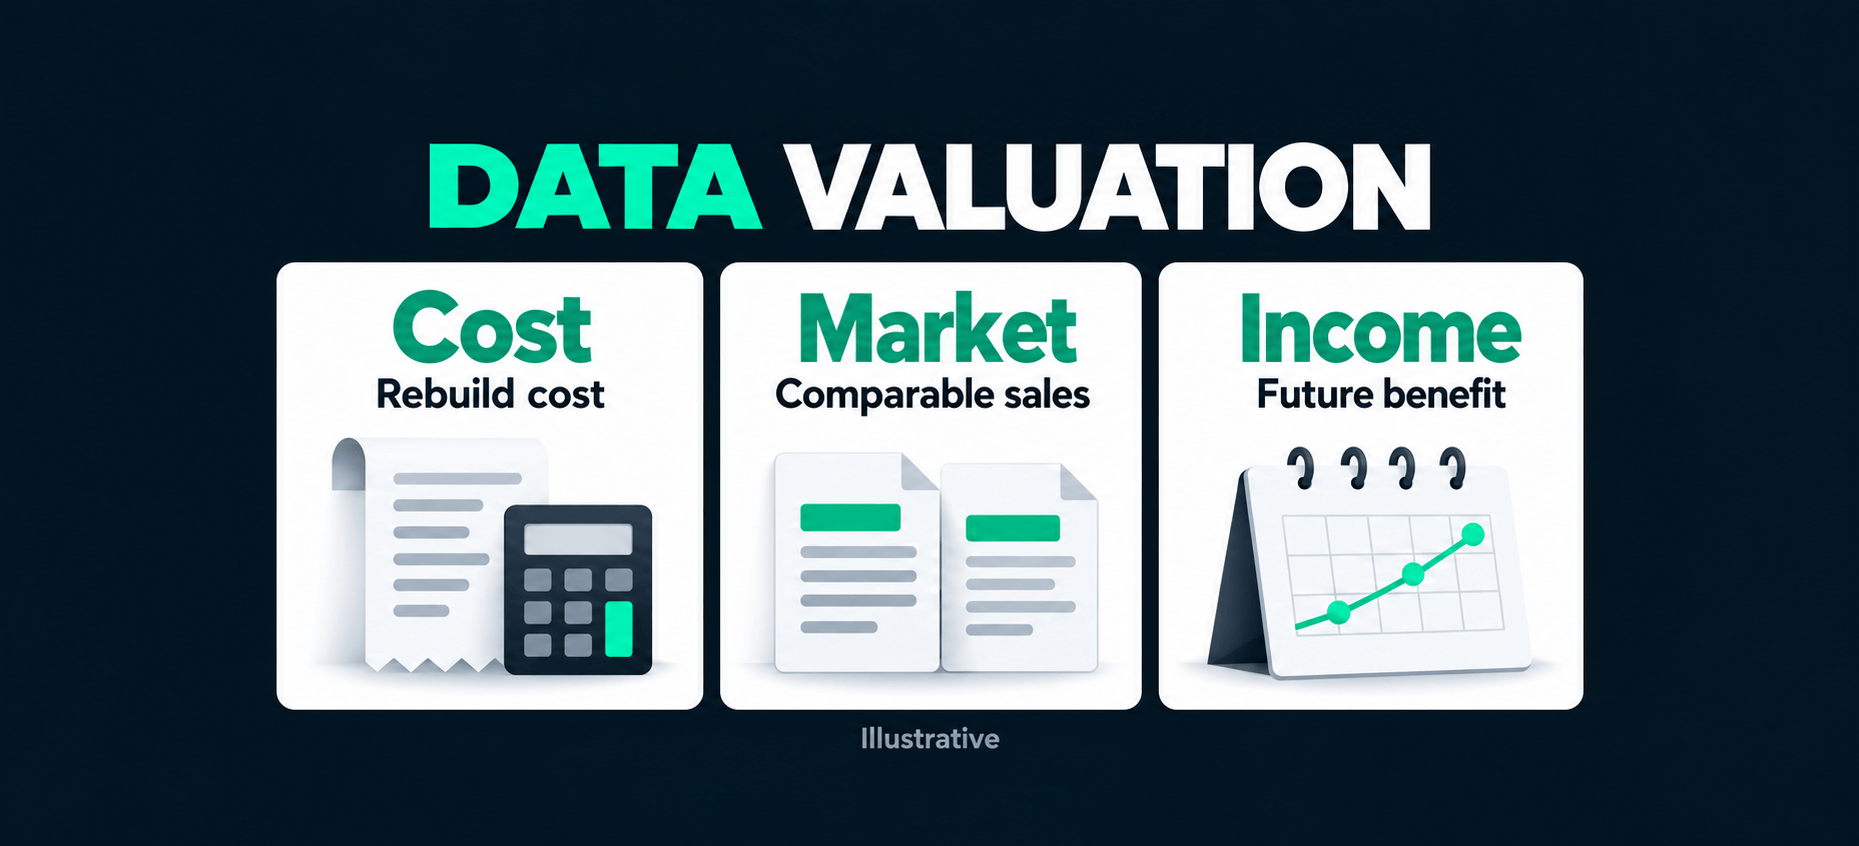
The short version: Three methods answer three different questions. Cost asks what it would take to rebuild a dataset, market asks what similar data sells for, and income asks what future benefit it brings, in today's money. Use cost when deciding whether to rebuild or insure, income when deciding whether to invest, and market when pricing a license. Report each as a range.
What are the main ways to value a dataset?
Three approaches do most of the work: cost, market, and income. Each needs different evidence and has a different blind spot, as the table below shows. Specialist methods exist too, but for most business decisions these three are where a valuation starts, and where a finance team will expect you to start.
| Method | Question it answers | Main weakness |
|---|---|---|
| Cost | What would it take to rebuild this today? | Measures effort, not benefit |
| Market | What do buyers pay for similar data? | Comparable deals are rare and private |
| Income | What is the future benefit worth today? | Rests on forecasts and assumptions |
The income approach relies on discounting: shrinking future money to its value today, because a dollar next year is worth less than a dollar now. It also needs a view on the odds that the benefit shows up.
For the specialist end, a practitioner framework from Fraunhofer ISST (opens in new tab) compares six approaches and maps each to the specific valuation question it can answer. Three of them go beyond the basics. Relief-from-royalty values data by the license fees you avoid by owning it. Real options value the flexibility data gives you to act later. Data Shapley measures how much each piece of training data adds to a model's performance.
Why do the methods give different answers?
Because they measure different things. Cost measures the effort to build or replace the data. Market measures what one buyer paid under one set of terms. Income measures the benefit to one particular user. With data, those three rarely line up, because copies cost almost nothing to make and different buyers value the same data differently.
Research from the OECD (opens in new tab) explains the pricing side. Digital data can be copied at nearly no cost, so the usual rule of pricing each copy at its cost plus a markup does not work. Data tends to be priced by its value to each buyer instead, and because buyers value the same data so differently, prices are set deal by deal.
That makes market comparisons scarce. According to the same OECD report, 15% of enterprises in Europe analyzed big data in 2019, but only 1.3% purchased data and only 0.6% sold it. Most data is produced and used by the same company, so for most datasets there is no recent sale to compare with.
When no market price exists, the OECD notes that national accounts fall back on two methods: the net present value of future income, or the sum of production costs. It adds that net present value requires numerous assumptions that may be difficult to justify, and that production costs may not fully capture data's economic value.
How does the math work on one dataset?
Here is the hypothetical from the opening in full. The company holds three years of anonymized delivery-route records, and a forecasting model built on them could cut fuel and delay costs. Each team uses its own method and its own inputs, so each reaches a different figure, and each figure answers its own question.
All numbers are invented to show the arithmetic. They are not benchmarks.
Finance: the cost approach. The company cannot go back and record its past routes again, so the closest substitute is licensing three years of comparable historical route data from a telematics vendor and preparing it.
- Vendor license for comparable historical data: $120,000.
- One data engineer for six months to match the vendor data to the company's systems, at a fully loaded cost of $180,000 a year (salary, benefits, and overhead): $180,000 × 0.5 = $90,000.
- Cleaning and quality checks: $40,000.
- Total: $120,000 + $90,000 + $40,000 = $250,000.
Operations: the income approach. Operations expects the model to save $90,000 a year for four years, net of the cost of running it, with each year's savings counted at year end. They discount at 12% a year, the company's assumed hurdle rate for ordinary projects. The specific risk that the model never delivers is handled separately, with a 70% chance of success, so the risk is not counted twice.
- Year 1: $90,000 ÷ 1.12 = $80,357
- Year 2: $90,000 ÷ 1.2544 (1.12²) = $71,747
- Year 3: $90,000 ÷ 1.404928 (1.12³) = $64,060
- Year 4: $90,000 ÷ 1.573519 (1.12⁴) = $57,197
- Present value: $80,357 + $71,747 + $64,060 + $57,197 = $273,361
- Risk-adjusted: $273,361 × 0.70 = $191,353, or about $191,000
Partnerships: the market approach. Partnerships knows of two recent three-year, non-exclusive licenses for similar regional route data, at $260,000 and $340,000. Their average, ($260,000 + $340,000) ÷ 2 = $300,000, is a reference point for a license on the same terms.
| Team and method | Figure | What it tells you |
|---|---|---|
| Finance, cost | $250,000 | What a substitute would cost today |
| Operations, income | About $191,000 | What the data is worth to this company |
| Partnerships, market | $300,000 | What an outside buyer might pay |
The spread is the useful part. If the data were lost, paying $250,000 for a substitute would cost more than the roughly $191,000 it is worth to the company, so replacing it would be hard to justify. Outside buyers, meanwhile, may value it more than the owner does, which makes licensing worth exploring.
Assumptions move the answer too. At a 50% chance of success, the income figure drops to $273,361 × 0.50, about $137,000. At 90%, it rises to $273,361 × 0.90, about $246,000. The honest income result is a range of $137,000 to $246,000, with $191,000 as the base case.
Keep in mind whose benefit operations measured. The $191,000 reflects this company's routes and savings. A buyer with a bigger network or a different use would run its own income estimate and might land well above or below it. That gap between owners is what makes licensing deals possible.
Which method should you use for your decision?
Lead with the method that matches your decision, and cross-check with a second one so a single assumption can't carry the whole answer. The pairings below cover the decisions finance and data teams face most often. Whichever you choose, four features of the data will move the result: rights, quality, exclusivity, and time.
- Funding, expanding, or retiring a dataset: lead with income and compare it with the next round of spending, such as the cost of refreshing or expanding the data. If the expected benefit doesn't cover that spend, the money is better used elsewhere.
- Licensing or selling data: lead with market and check it against income. Your own income figure shows what the data is worth to you, which tells you what an exclusive deal costs you.
- Rebuilding, replacing, or insuring data: lead with cost. It answers the practical question of what you would have to spend if the data disappeared tomorrow.
- Briefing a board on data as an asset: lead with income, show cost and market alongside it, and present the result as a range.
And the four features that move every method:
- Rights. Internal analytics, external licensing, and AI training are different permissions. A use you cannot lawfully pursue adds nothing to the value.
- Quality. Gaps, errors, and missing documentation mean someone has to pay for cleanup, which lowers the net benefit.
- Exclusivity. Data can be licensed many times, so an exclusive deal may earn a premium but rules out other sales. Value also drops if competitors hold the same data.
- Time. Data goes stale, and benefits arrive over years. History you collected yourself may not be for sale anywhere, so a cost figure can understate it. Always state the valuation date.
If you are still deciding how your data should earn money in the first place, our guide to data monetization compares the main options.
How do you make a valuation you can defend?
Write down every input, where it came from, and what happens if it is wrong. Report a range with a base case rather than a single figure. A finance team, an auditor, or a buyer should be able to rebuild your number from the record and reach the same answer.
A short assumption register covers most of it:
- The decision the valuation supports, and the valuation date.
- The method you chose, and why you set aside the others.
- Each input, its source, and who signed it off.
- The discount rate, time horizon, and probability of success.
- The rights and restrictions that limit how the data can be used.
- A sensitivity range, and who owns the next review.
Two shortcuts undo good work. Don't average the cost, market, and income figures: they answer different questions, so their average answers none of them. And don't treat an asking price as a value. A listing shows what a seller hopes to get, not what anyone paid.
You don't have to build every model by hand. Datavault AI's DataScore® checks a dataset's quality first, because gaps and errors pull value down. DataValue® then estimates what the dataset is worth with an AI-driven model and explains the method in plain English, so your finance team can follow it and challenge it. See the Datavault platform (opens in new tab) or our guide to reading a DataValue report. If you are comparing providers, read how to choose a data monetization platform.
How do you start valuing your own dataset?
Write one sentence that says what the valuation is for, then pick the method that answers that question. In our example, a licensing decision points to partnerships' $300,000, checked against operations' $191,000, while a decision about replacing lost data points to finance's $250,000. Gather the inputs, show the arithmetic, and report a range.
If you want to see how a data valuation works in practice, ask the Datavault AI team for a walkthrough.
Request a Datavault demo (opens in new tab)
FAQs
Is data worth what it cost to collect?
Not necessarily. Cost tells you what it would take to rebuild or replace the data, which is a useful reference point. Value depends on what the data lets someone do, so cheap data can be worth a lot and expensive data can be worth little.
Is an estimated value the same as a sale price?
No. An estimate is a modeled figure built on stated assumptions. A sale price is what one buyer agreed to pay under specific terms. Estimates help you set an asking price and judge offers, but they do not predict what a buyer will pay.
How often should you revalue a dataset?
Once a year is a sensible default. Revalue sooner when something material changes: your rights to use the data, its quality or coverage, a new comparable deal, your discount rate, or a planned sale or license.
Date
November 2, 2026
Category
Technology
 Back to Media & Insights